Lens
Lens is a platform that transforms complex wildfire data into an accessible and engaging experience. By allowing users to explore data more naturally, Lens empowers individuals to identify trends in wildfire behaviour, fostering a deeper awareness of the dynamic nature of wildfires. Users can observe the progression of fire fronts in real-time by tracking the changing positions of hotspots or compare the variation in hectares burned across the years, enabling them to observe trends both past and present.
LAYERS
Evacuations
Background
The Evacuation Orders and Alerts produced by GeoBC is an aggregate of active orders and alerts issued by the Local Governments or First Nations. There are many different event types represented, not just for wildfire. For example you may also see alerts or orders for floods, landslides, infrastructure damage, avalanche, and many more.
Interpretation
The data that is presented on hover is, in order of appearance:
- ORDER_ALERT_STATUS: the current status of the even, e.g., Order, Alert, All Clear.
- ISSUING_AGENCY: The name of the agency that issued the event
- EVENT_NAME: the name assigned to the event
- DATE_MODIFIED: the date the record was last updated
Evacuation data sourced from GeoBC Branch of the Government of British Columbia under the terms of the Open Government License - British Columbia
Fire Corridors
Background
The fire corridor data was adapted from the paper Mapping the distance between fire hazard and disaster for communities in Canadian forests. The researchers used Burn P3 fire simulation modelling to map potential pathways a fire might take to reach a community. A corridor is the accumulation of such pathways. Lens displays the fire corridors for 1850 Canadian communities.The data that is presented on hover is, in order of appearance:
- Avg. ROS: average rate of spread (ROS) for the fire pathways that traverse the corridor segment
- Total minutes: travel time in minutes for the fire to traverse the corridor segment
- nFires: number of fire pathways that traverse the corridor segment
- rFires: number of fire pathways that traverse the corridor segment divided by the total fire pathways
Interpretation
The colour profile uses D3's BuPu sequential interpolation. A sequential colour scheme is a continuous colour profile that transitions smoothly through shades between two colours, in our case pale blue to purple. The colour represents the rFires value defined above so the darker (closer to purple) the segment is, the more likely a fire is to travel that particular segment.Fire corridor data adapted from Swystun, T. (2024). Mapping the distance between fire hazard and disaster for communities in Canadian forests [Data set]. Zenodo. https://doi.org/10.5281/zenodo.10594234. This data has been aggregated and tiled for use in web based GIS tools. Modifications made are licensed under CC-BY 4.0. License: https://creativecommons.org/licenses/by/4.0/.
Fuel
Background
The Canadian Forest Fire Behavior Prediction (FBP) System fuel types are created by the Canadian Wildland Fire Information System (CWFIS). The data is derived from satellite imagery, primarily MODIS (Moderate Resolution Imaging Spectroradiometer) with a 30m resolution. They use a number of different factors to classify the fuel type. It only represents a general approximation.
Interpretation
The colours used for the fuel layer are an industry standard. These are the same as you will find in CWFIS' background information section: FBP Fuel Types. There they also have descriptions of each fuel type.
- C-1 Spruce-Lichen Woodland
- C-2 Boreal Spruce
- C-3 Mature Jack or Lodgepole Pine
- C-4 Immature Jack or Lodgepole Pine
- C-5 Red and White Pine
- C-7 Ponderosa Pine / Douglas Fir
- Water
- D-1/D-2 Aspen
- O-1a Matted Grass
- M-1/M-2 Boreal Mixedwood
- Vegetated non-fuel
- Non-fuel
- No data
Fire Behaviour Prediction (FBP) Fuel Types are sourced from the Natural Resources Canada under terms of the Open Government License - Canada
Hotspots
Background
The Fire Monitoring, Mapping, and Modeling (Fire M3) System, an initiative by Natural Resources Canada, uses infrared satellite imagery provided by US National Oceanic and Atmospheric Administration (NOAA), the US National Atmospheric and Space Administration (NASA), and various other organizations to identify fires burning on the landscape. After some post-processing they publicly release daily hotspot maps for all of Canada. The CWFIS also provides the hotspots data through their datamart.
Interpretation
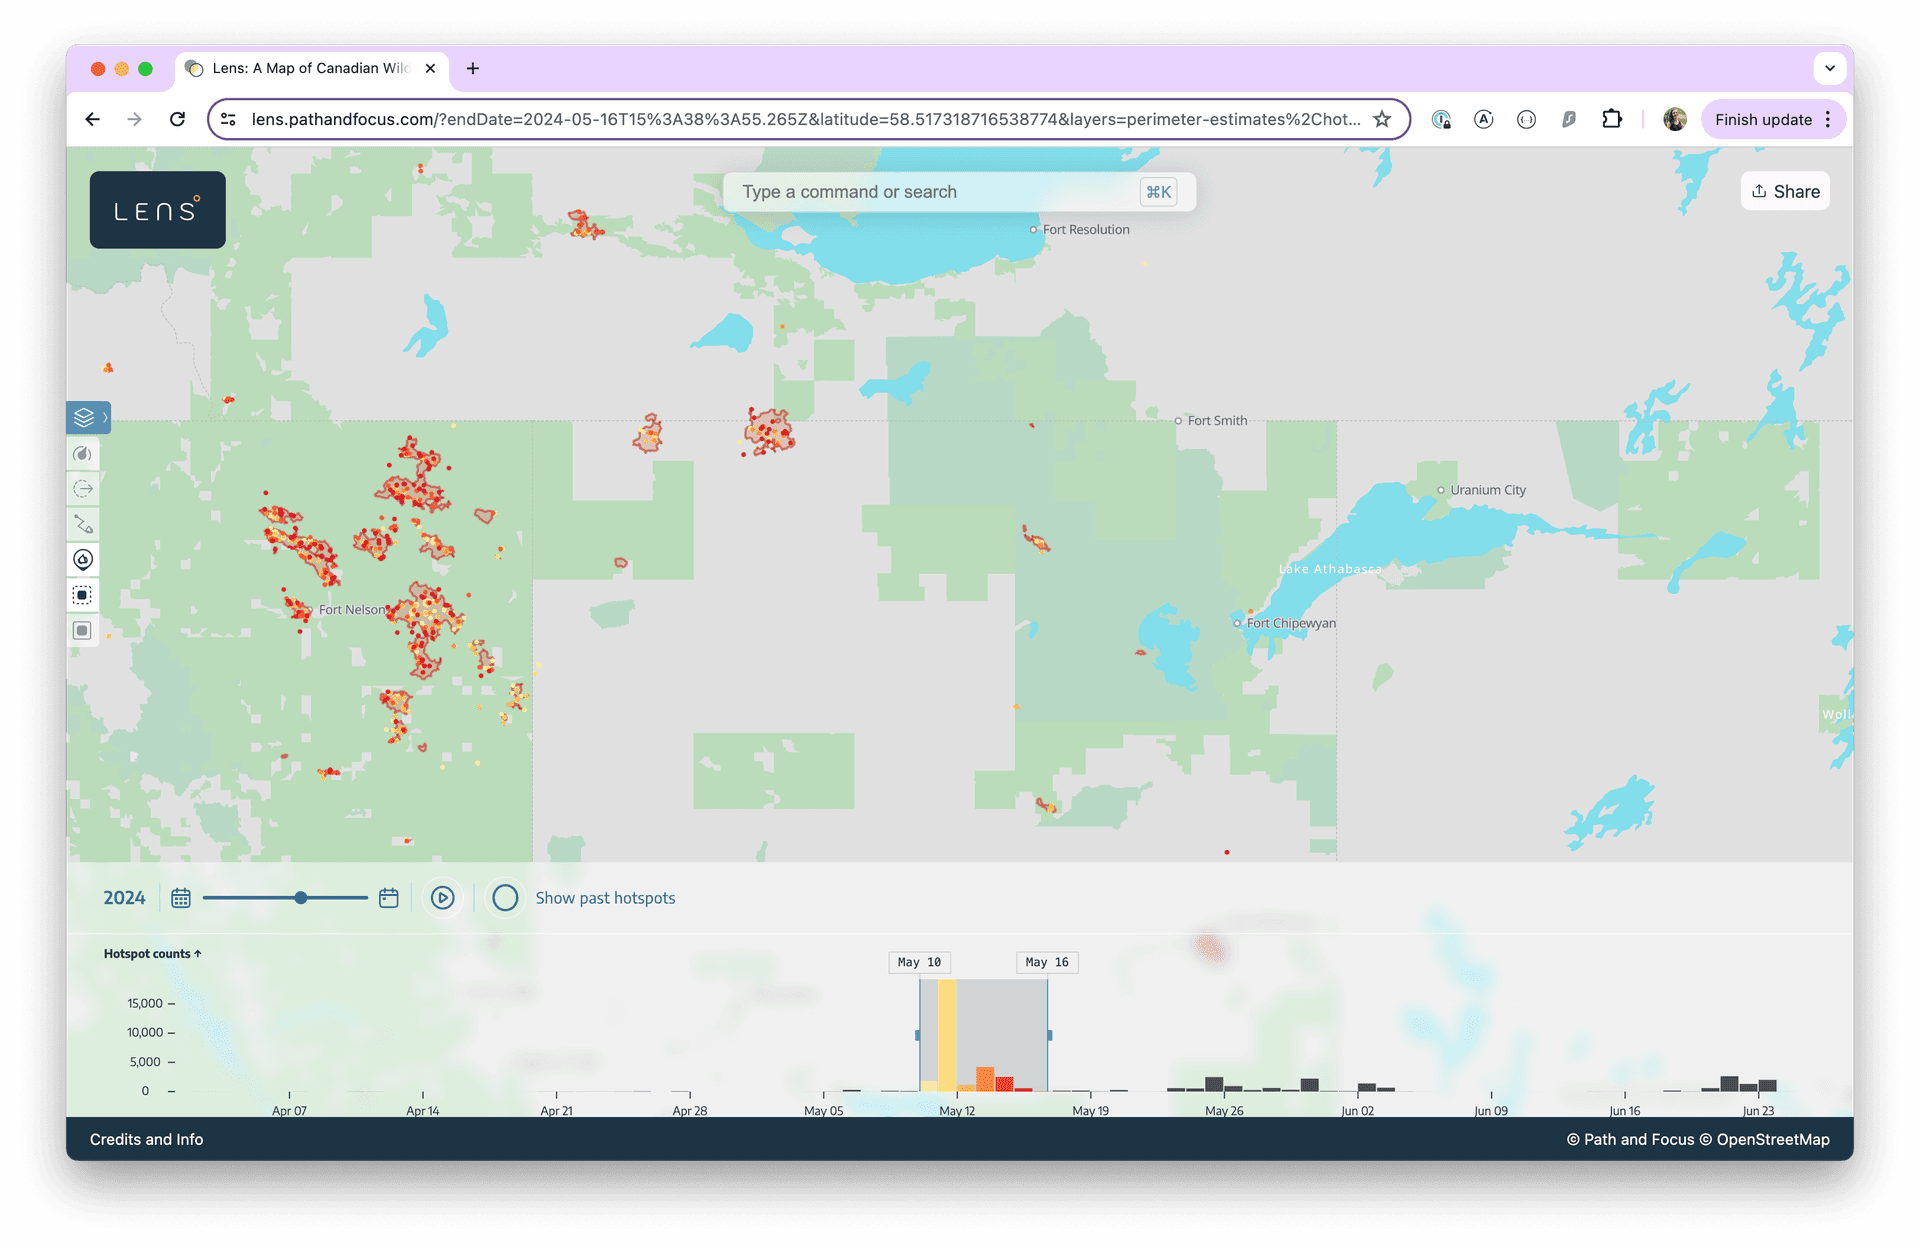
The hotspots are visualized in two ways. As coloured points on the map and as a histogram timeline. The colour profile uses a discrete colour scheme with three primary colours: red, orange, and yellow, and three secondary greys. We're using these to represent a relative value in reference to the leading (right) edge of the time selection window. It does not represent an absolute fire intensity.
- Hotspots newer than the time window
Leading edge (right) of the selection
Today (0-24hrs)
- Previous day (24-48hrs)
- 2 days ago (48-72hrs)
Hotspots older than 2 days and in the time window
Trailing edge (left) of the selection
- Hotspots older than the time window
Fire M3 hotspot data © Canadian Forest Service. 2022. Canadian Wildland Fire Information System, Natural Resources Canada, Canadian Forest Service, Northern Forestry Centre, Edmonton, Alberta. http://cwfis.cfs.nrcan.gc.ca
Fire Perimeter Estimates
Background
The perimeter estimates are a secondary product that Natural Resources Canada creates using the M3 hotspots. The polygons approximate a fire perimeter using the outer bounds of the year-to-date hotspot data. These are separate from the official fire perimeters released by the BC Wildfire Service (BCWS).
Interpretation
The fire perimeters are an estimation only and therefore are less accurate than the official perimeters released by the BCWS. However, we do not have official fire perimeters for every province for every year so these act as the best guess approximation for the provinces and years that do not have official data.
Fire perimeter estimate data © Canadian Forest Service. 2022. Canadian Wildland Fire Information System, Natural Resources Canada, Canadian Forest Service, Northern Forestry Centre, Edmonton, Alberta. http://cwfis.cfs.nrcan.gc.ca
Fire Perimeters
Background
The fire perimeter data is an amalgamation fire polygons provided by many different Canadian fire management agencies. The current year data includes both active and inactive fires and is restricted to BC. The current data comes from many operational sources and may vary in their update frequency. For this reason they may not represent the most up-to-date information. However, they still roughly represent the current official status of a fire. The historic fire perimeters also vary in availability by province. Here is a list of available data.
- BC: 1994-2020 & current year
- AB: 1994-2020
- SK: 1994-2020
- MB: 1994-2020
- ON: 1994-2020
- QC: 1994-2020
- NS: 1994-2020
- NB: 1994-2013
- NL: 1994-2016
- YT: 1994-2020
- NT: 1994-2020
- PC: 1994-2015
Interpretation
If you hover of the polygon it will give you some general purpose information about the fire
- Fire Number
- Status: Out of Control, Being Held, Under Control, Out
- Estimated fire size in hectares
- Track Date
The Track Date represents the date that the perimeter was initially tracked via GPS. It is not the same as the Last Updated or Discovered On attributes, which you'll find in the BCWS mobile app. The data source may get updated without the track itself changing.
Current fire perimeter data sourced from the BC Wildfire Service of the Government of British Columbia under terms of the Open Government License - British Columbia. Historical fire perimeters, pre-2023, contains information licensed under the Open Government License - Canada.
Satellite Data
Background
The dataset comes from the Multispectral Instrument (MSI) onboard Sentinel-2 via the Earth Search STAC API . A SpatioTemporal Asset Catalog (STAC) is a specification for structuring and querying geospatial data. This is particularly useful for large dataset because it allows for searching through the metadata to find only the desired assets before fetching the real data. For instance, in our implementation, we filter the images by the center of the viewport and the selected time window. In this way we're able to provide the thumbnail images more quickly. The other file format we take advantage of is a Cloud Optimized GeoTIFF (COG). COGs allow for partial reads of raster data. This allows us to only fetch only the portion of the image that is within the viewport. Another benefit is the ability to downsample the images, which we take advantage of and downsample to 512x512 images.
Interpretation
To view an image you first click a thumbnail. That “selects” the image and will pin a larger version of the image above and render it on the map. What we show on the map is the true-colour image derived from the red, green and blue bands of the MSI. Users can select multiple images, however, only one image at a time will be visible on the map. To change which image is displayed on the map you simple click between the different “selected”, larger thumbnails. As you pan and zoom around the map or adjust the date window, the thumbnail images will change in response. Any pinned images will remain pinned even if they are no longer in the center of the viewport or from within the current date window.
Copernicus Sentinel data [2024]
Weather
Background
Our weather data comes from the Meteorological Service of Canada (MSC) and WFWX datamart.
Interpretation
The display value represents the latest reported data available for today.
MSC data is provided by Environment and Climate Change Canada (ECCC) under the Data Servers End-use Licence, Version 2.1 (September 2022).
WFWX data is sourced from the BC Wildfire Service of the Government of British Columbia under terms of the Open Government License - British Columbia.
INTERACTIONS
Histogram
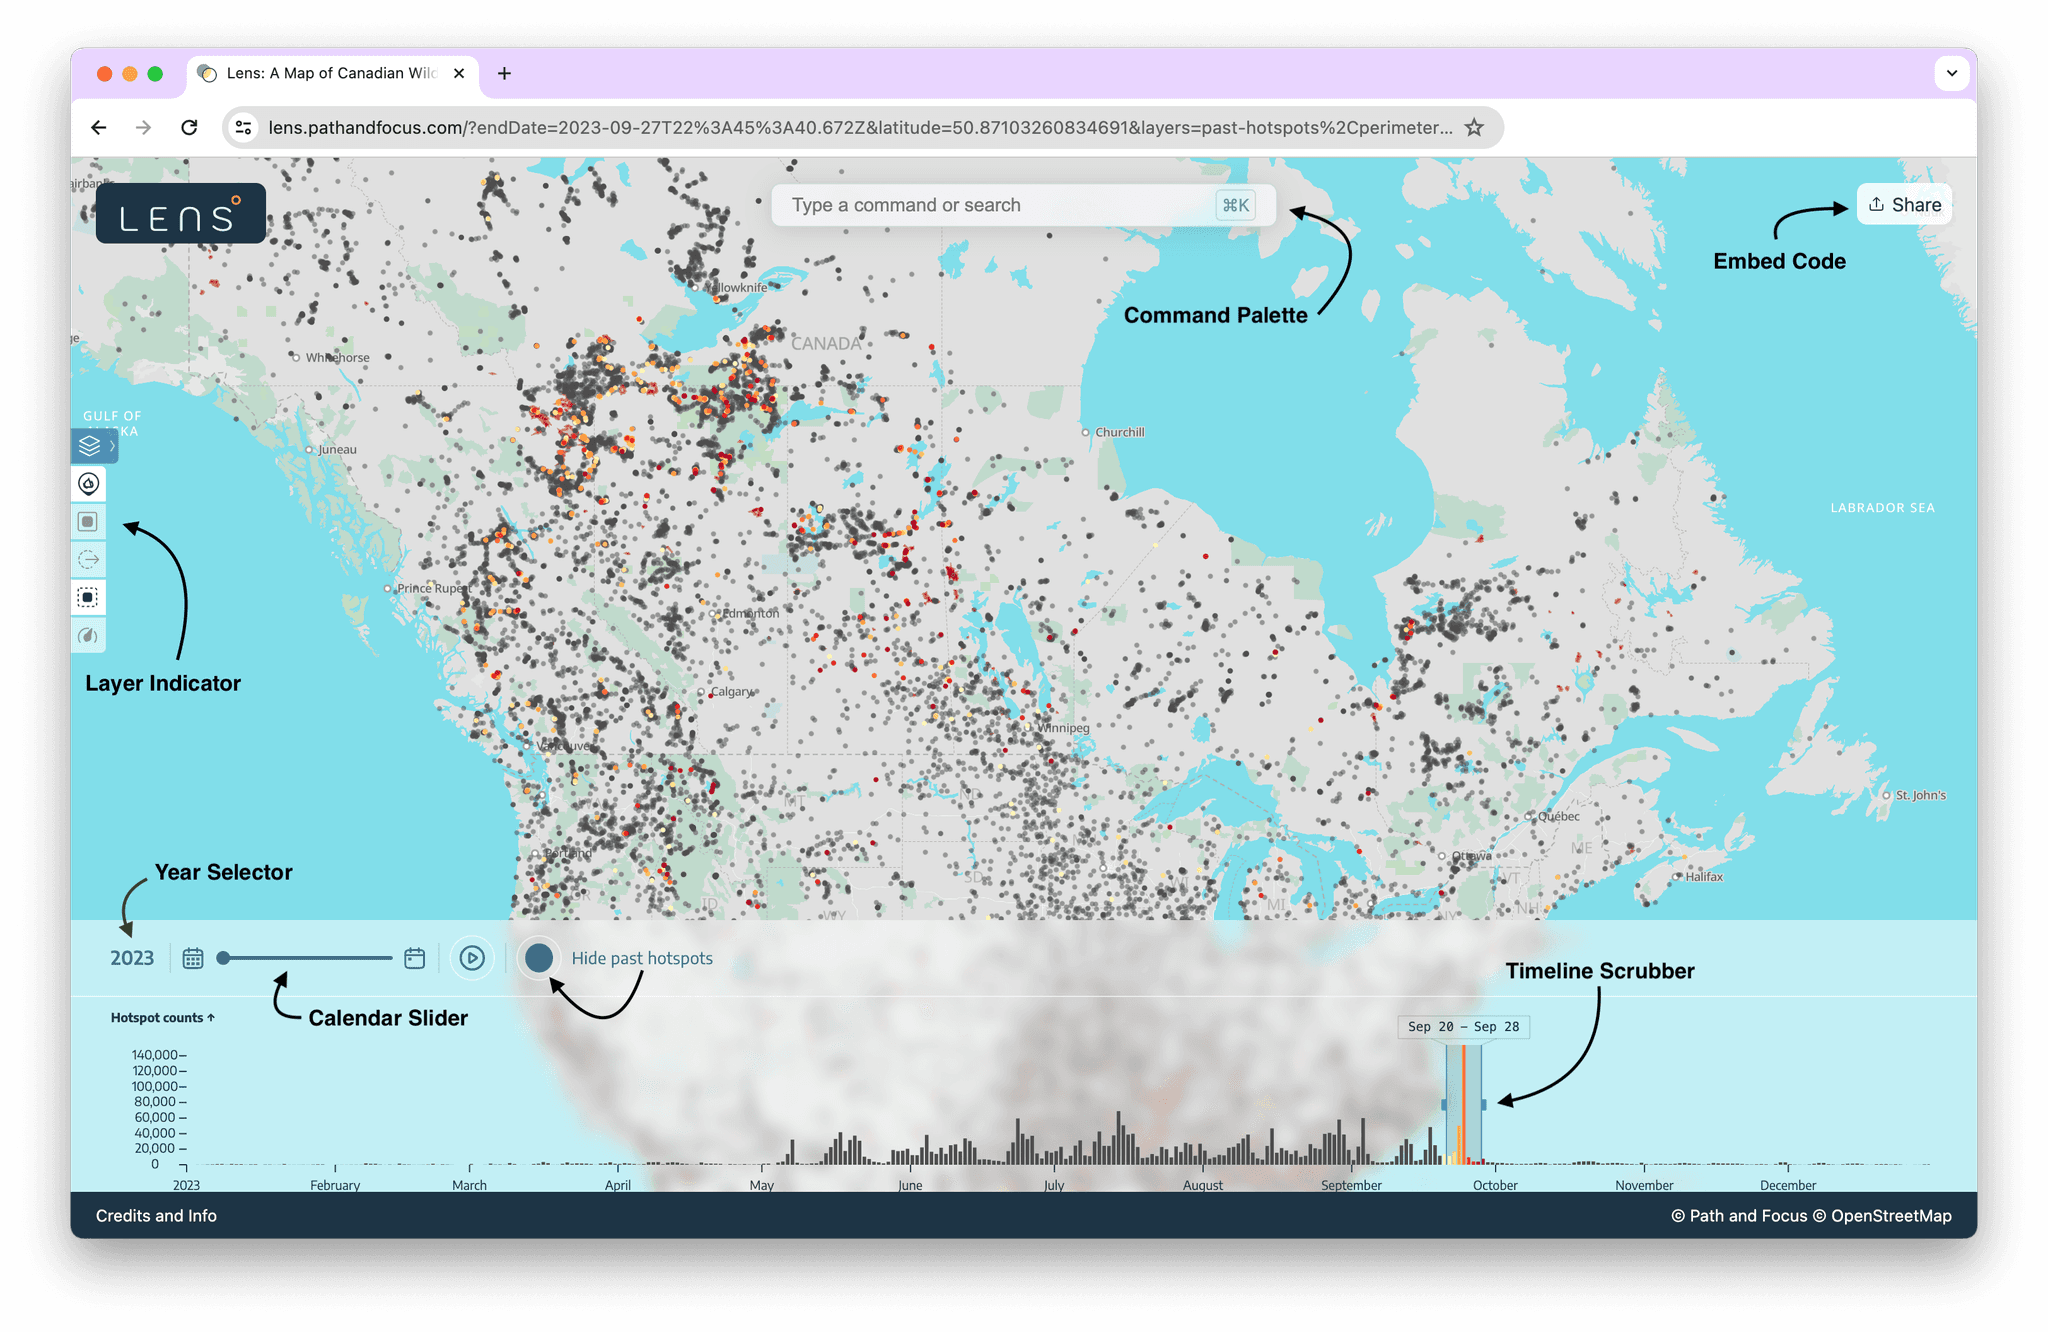
Year Selector
The year selection is primarily used to change the hotspot data.
- The Evacuations and Perimeter Estimates layers are not bound to the year selection. They will ALWAYS show current data.
- The Fire Perimeters are bound to the year selection, however, we currently only have data available for 2024.
Calendar Slider
This helps shrink or expand the date range. The right side of the X-axis is fixed to today. By using the slider you change the start date of the X-axis.
Show/hide past hotspots
The default behaviour is to only show the hotspots that are selected by the scrubber window. If you toggle this on then all the hotspots from the beginning of the year to the end date of your scrubber will be visible, however, all the hotspots outside of the selection window will be grey.
Timeline scrubber
The Y axis of histogram is an aggregation of all the hotspot counts in the visible map window per day. As you scrub across the timeline the hotspots visible on the map will update to reflect the fire state during that block of time.
Command Palette
A Command Palette is a user interface found in many software applications that allows users to quickly execute commands by typing them, without needing to use your mouse to navigate. It is triggered by typing ⌘K (on MacOS) or CTRL-K (on Windows). You can then type a command which will filter the available options. Once the command you want is highlighted you can hit Return or Enter to execute it. The up and down arrows can also be used to navigate. If you want to close the Command Palette hit Esc or re-execute ⌘K or CTRL-K.
The Command Palette is broken up into three different sections: Layers, Features, and User.
Under the Layers you find a list of the possible data you can display on the map.
The Features are additional interaction that can be performed. Show/hide past hotspots achieves the same outcome as the toggle button on the Hotspot Histogram. The Copy embed code will add a iframe html tag to your clipboard. The same functionality can be achieved using the Share button on the main map view.
The User section will display different things depending on whether you are logged in. Some of our layers require you to be a paid user. If you are not logged in then you will see Sign up for Lens Pro and Log in to Lens Pro. If you are logged in then you will see a Log out button.
If you've already signed up but are not logged in you can click on the log in button and you will redirected to the login modal.
Layer Indicator
The layer indicators at the left side of the map view is another way to turn on and off the map data. This is a mouse-forward way of accomplishing the same effect as provided by the Command Palette. It is collapsed by default and only shows the layer icons. If you hover an individual icon the full layer name will unroll. If you want all the layer names to be fixed visible then you can click on the top layer icon. If you click on it again it will fold back to it's collapsed state.
Share
An html iframe tag is used to embed a document into another document. Use this code to render Lens directly in your web page! Click on the Share button to see the iframe code. Click COPY to copy it to your clipboard and then paste it directly into your own site.
Credits
To learn where we've sources our data and find licensing information you can click on Credits and Info in the footer. It will list the information relevant to the currently visible data. So if you're looking for a specific reference make sure you've toggled on that layer.
URL
Our URL is pretty long and ugly but it serves an important purpose. We've built Lens so that all the vital information is encoded in the URL. Practically what this means is that when you link to Lens you can ensure that your readers will be taken to the exact view you want. The selection window, the year, which layers are visible, the map extent and zoom level are all encoded in the URL ensuring view replicability.
How this works: the base url is https://lens.pathandfocus.com and then the rest of the information is in the query parameters, key-value pairs attached at the end of the URL following the ? symbol. The following are the keys we use and how to structure them if you want to adjust them manually. A note on the date time string: they are in ISO date time format using the UTF-8 character set. That being said, the dates are extremely forgiving. In UTF-8 %3A represents a colon :. However, if you create the URL yourself you can use a colon instead and then when you paste it into the browser, the colons will be automatically converted for you. If you want, you can actually take the time out entirely. In that case, it will be treat as the start of the day. The benefit of all of this is that you can greatly reduce the length of the URL and make it a lot more human-readable if you wish.
(A similar thing exists for the comma-separately lists used for the layers. In UTF-8 %2C represents a comma, so either you use %2C or you use a comma. Either way it will also be automatically converted for you).
This might sound a bit confusing but keep in mind you do not need to interact with these directly. The URL is updated automatically as you navigate and toggle things on and off within the site.
Query Parameters
startDate
This sets the oldest date (the left-hand side) of the selection window of the timeline scrubber.
Format: An ISO date-time string, eg. endDate=2023-09-20T21%3A59%3A59.999Z
endDate
This marks the most recent date (the right-hand side) of the selection window of the timeline scrubber.
Format: An ISO date-time string, eg. startDate=2023-08-20T06%3A00%3A00.021Z
minDate
This controls the calendar slider so the date that sets position 0 on the x-axis.
Format: An ISO date-time string, eg. minDate=2023-05-01T00%3A00%3A00.000Z
latitude
Represents the latitude of the centre point of the map view.
Latitude refers to how far north or south a point is from the Equator. Ranging from -90.0 to +90.0. Positive values indicate locations north of the Equator, while negative values indicate locations south of the Equator. For Canada we range from 41 in Southern Ontario to 83 in Northern Nunavut.
Format: Decimal degrees, eg. latitude=50.6745
longitude
Represents the longitude of the centre point of the map view.
Longitude refers to far east or west a point is from the Prime Meridian (an imaginary line running from the North Pole to the South Pole through Greenwich, England). It ranges from -180.0 to +180.0 where positive values indicate locations east of the Prime Meridian and negative values indicate locations west of the Prime Meridian. For Canada we range from approximately -141 to -52.
Format: Decimal degrees, eg. longitude=-120.3273
zoom
The smaller the number the more zoomed out you are. For instance 3 is approximately the zoom level of Canada, whereas 20 would be the zoom level of an individual house.
Format: Decimal number from 0 to 20, eg. zoom=3.5
layers
Indicates which layers an visible; if they are included in the list they are visible on the maps. The options are: hotspots, burn-severity, evacuations, fire-corridors, fire-perimeters, and perimeter-estimates.
Format: Comma-separated list, eg. layers=hotspots%2Cperimeters
pastHotspots
0 to have them turned off and 1 to have them turned on.
Format: Binary, eg. pastHotspots=1